Beware delays in SQS metric delivery
A couple of weeks ago, I fixed what’s been a long-standing and mysterious bug in our apps, which was caused by a new-to-me interaction between SQS and CloudWatch metrics. The bug hasn’t recurred, so I’m fairly confident my fix has worked.
I talked about the bug at a team meeting, because I found it quite interesting – and I’m writing it down to share it with a wider audience. I’m sure I’m not the only person who misunderstood the SQS/CloudWatch relationship, and in particular the implications of delayed metrics.
How our apps work
We have a set of pipelines for processing data – multiple apps connected by queues. Each app receives messages from an input queue, does some processing, then sends another message to an output queue for the next app to work on. It’s a pretty standard pattern.
We use Amazon SQS for our queues, and Amazon ECS to run instances of our apps.
Our pipelines are typically triggered by a person doing something, say, a librarian editing a catalogue record – so the amount of work for the pipeline have to do will vary. There’s plenty of work at 11am on a Tuesday, less so at midnight on a Sunday.
To make our pipelines more efficient, we adjust the number of tasks in our ECS services to match the available work. If there’s lots of work to do, we run lots of tasks. If there’s nothing to do, we don’t run any the tasks. This introduces some latency (if the pipeline is scaled down and new work arrives, we have to wait for the pipeline to scale up), but we don’t need real-time processing so the efficiency gains are worth it.
We use CloudWatch to automatically adjust the number of tasks.
Each SQS queue is sending metrics to CloudWatch, telling it how many messages it has. We have CloudWatch alarms based on those metrics, and when they’re in the ALARM state, they adjust the task count. In particular, we have two alarms per service:
-
The “scale up” alarm: if there are messages waiting on the queue, start new tasks.
This alarm uses the
ApproximateNumberOfMessagesVisiblemetric, the number of messages available to retrieve from the queue. The alarm adds tasks if this metric is non-zero. -
The “scale down” alarm: if the queues are empty, stop any running tasks.
This alarm uses the sum of the
ApproximateNumberOfMessagesVisible,ApproximateNumberOfMessagesNotVisibleandNumberOfMessagesDeletedmetrics. This is the number of messages available to retrieve, the number of messages currently being processed by a service, and the number of messages that have just been deleted. The alarm stops tasks if this sum is zero.(I’m not sure why we track the number of deleted messages, and I suspect it was a failed attempt to work around the bug described in this post.)
These alarms check the queue metrics once a minute, then decide whether to adjust the task count. This system isn’t perfect, but it’s mostly worked for a number of years, and when it works it works extremely well. Our pipelines automatically scale to match the amount of work available, and we almost never have to think about it.
The problem we were seeing
If a message can’t be processed, it gets sent to a dead-letter queue (DLQ). This triggers an alert in our internal monitoring, and we know we have to go and investigate.
We start by looking in the app logs, where you often see an error at the same time the message was being processed. Something went bang in the app, and the cause of the failure is obvious.
But we’ve always had a trickle of messages which fail for no obvious reason. They got sent to the DLQ, but there weren’t any errors in the logs and the messages worked if you resent them.
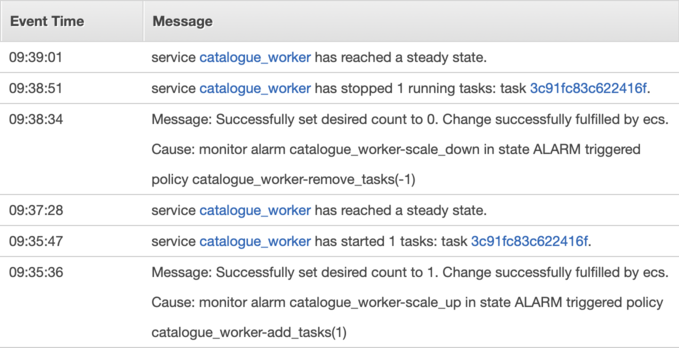
What we could see was that apps were being stopped even though they were still processing messages. In the ECS event log, we could see the CloudWatch Alarm adjusting the task count to zero. This stopped the app, and SQS never got an acknowledgement that the message had been processed successfully – so it moved the message to the DLQ.

This was mildly annoying, but because we had an easy workaround we never investigated properly.
Recently that trickle became a torrent, and we saw more and more tasks being stopped, even though they still had work to do. We had to fix it properly.
Looking in the CloudWatch console
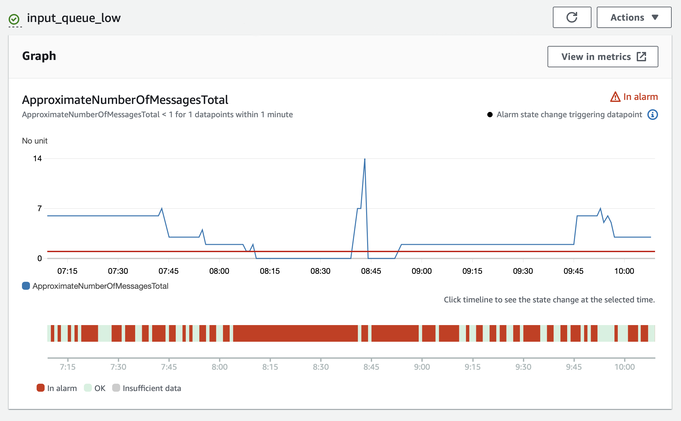
I had a look at the “scale down” alarm in the console, and what I found was surprising:

This alarm monitors whether there are any queue messages (either waiting on the queue or being processed by an app), and it should only trigger if there aren’t any messages.
The blue line in the first graph shows the number of messages. Notice that for most of this period, it’s above zero – so the alarm shouldn’t trigger.
But the second graph tells a different story – the dark red blocks show when the alarm was in the “in alarm” state, and it’s up/down like a yoyo. Every time that bar goes red, the alarm would tell ECS to stop tasks – and if a task was working on a message that it couldn’t finish before it was stopped, that message would end up on the DLQ.
But why doesn’t the alarm state match the metric? There’s a tooltip behind the innocuous looking info symbol in the corner:
Alarm state triggering datapoint
The alarming datapoints can appear different to the metric line because of aggregation when displaying at a higher period or because of delayed data that arrived after the alarm was evaluated.
I didn’t get the significance of this message the first time I saw it, and it took me quite a while to realise it was a big clue.
SQS metrics can be delayed by up to 15 minutes
Searching for various terms like “delayed” and “sqs” and “metric”, I eventually stumbled upon this note in the AWS documentation:
CloudWatch metrics for your Amazon SQS queues are automatically collected and pushed to CloudWatch at one-minute intervals. These metrics are gathered on all queues that meet the CloudWatch guidelines for being active. CloudWatch considers a queue to be active for up to six hours if it contains any messages or if any action accesses it.
Note: a delay of up to 15 minutes occurs in CloudWatch metrics when a queue is activated from an inactive state.
I’d never seen this before, but suddenly a lot of things made sense.
Our queues are mostly inactive, because there are long periods when nothing is happening (any time outside UK working hours).
Especially at the start of the day, queue metrics might be delayed by up to 15 minutes – but our alarms were evaluated every minute. If the “scale down” alarm was looking at a metric which was delayed, it’d see zero messages on the queue and tell the task to scale down. But later in the day, a developer starts debugging a broken queue and everything works like they’d expect, because the queue is active and metrics are no longer delayed.
What changed to make this more of an issue?
This isn’t new behaviour from CloudWatch, and in retrospect I can see a bunch of places where this has affected us in the past. We’ve always had a trickle of messages that failed for unexplained reasons, and which succeeded on a retry. Why did it become a torrent?
I suspect our tasks have been yoyo-ing for a while. Messages arrive on the queue, the scale up alarm starts new tasks, which the scale down alarm stops a minute later. A minute after that, the scale up alarm starts more new tasks because the queue isn’t empty yet, and the scale down alarm stops them after a minute more. Rinse and repeat. Tasks are only running for a minute or so at a time.
We wouldn’t notice this if a message could be processed quickly, or if the queue only had a few messages – if everything finished before the task got scaled down, nothing would go to the DLQ.
But recently we’ve had messages that take longer and longer to process. In particular, we’ve been doing A/V digitisation that involves large files, often 200GB or more. We can’t do all the processing on those files within a minute, so they’re more likely to hit this problem – and that’s where we saw the torrent of failures.
This failure mode has always existed, and it’s pure luck that it only recently became a big problem.
How we fixed it
You can tell CloudWatch how often you want to evaluate alarms. Previously we checked the scale down alarm every minute, but we’ve increased that to 15 minutes – so we wait out any delayed metrics. The alarm should always use complete data, and it won’t scale down the app until the queue has been empty for at least quarter of an hour.
(This does introduce some inefficiency, which is why we’ve only applied it to select apps.)
I deployed this change about a fortnight ago, and despite much more large AV and regular pipeline activity, the mysterious SQS errors have completely stopped. Hubris dictates that a new error will appear as soon as I hit publish, but right now I’m happy with this fix.
Three takeaways
Most of what I’ve learnt is too specific to our setup to be of general interest, but these are the key lessons worth sharing:
-
Know that SQS metrics can be delayed by up to 15 minutes. I assumed SQS metrics were always accurate to the minute, and that flawed assumption caused a bunch of subtle failures.
-
Remember that normalisation of deviance exists, and makes problems invisible. There’s been a trickle of mysteriously failing messages for years, but ignoring them became normalised.
There have been other times I’ve been confused by SQS-based behaviour, but not enough to investigate – and in hindsight, they were almost certainly caused by delayed metrics. If we’d investigated sooner, we’d have avoided confusion and errors.
-
Explaining something will help you understand it. Writing this blog post means I’ve spent a lot more time thinking about the issue, and I’ve spotted a bunch of implications and previous occurrences that I missed when I was only trying to fix the bug in front of me.